
Harmony score
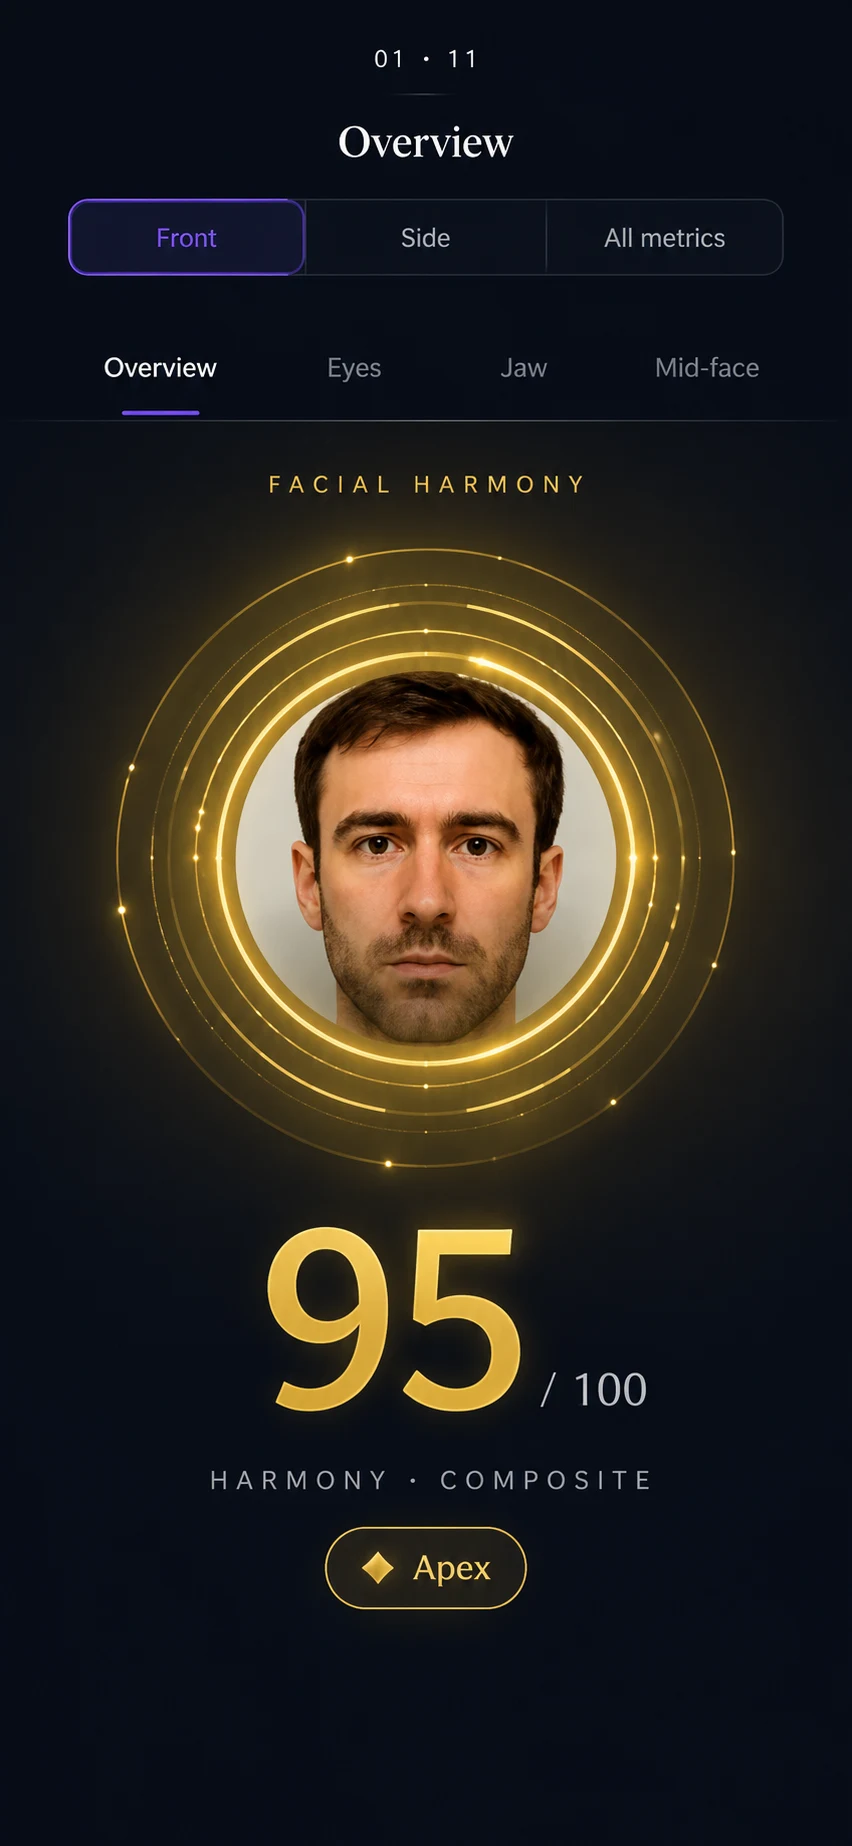
A harmony score is only worth having if you can see the measurements under it.
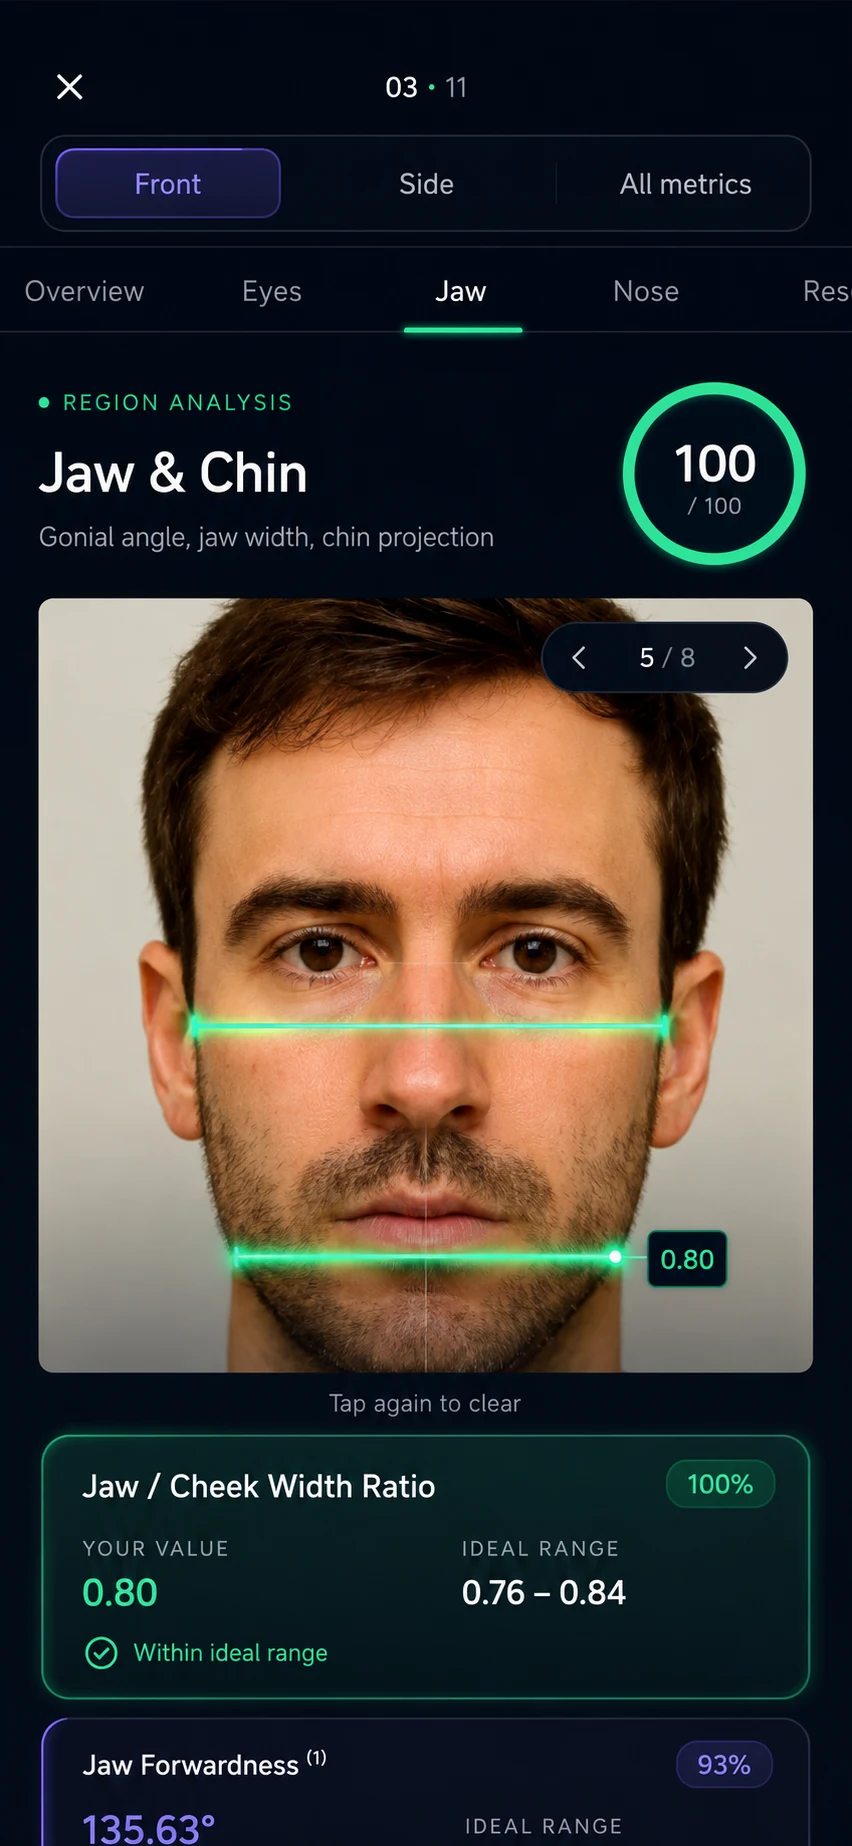
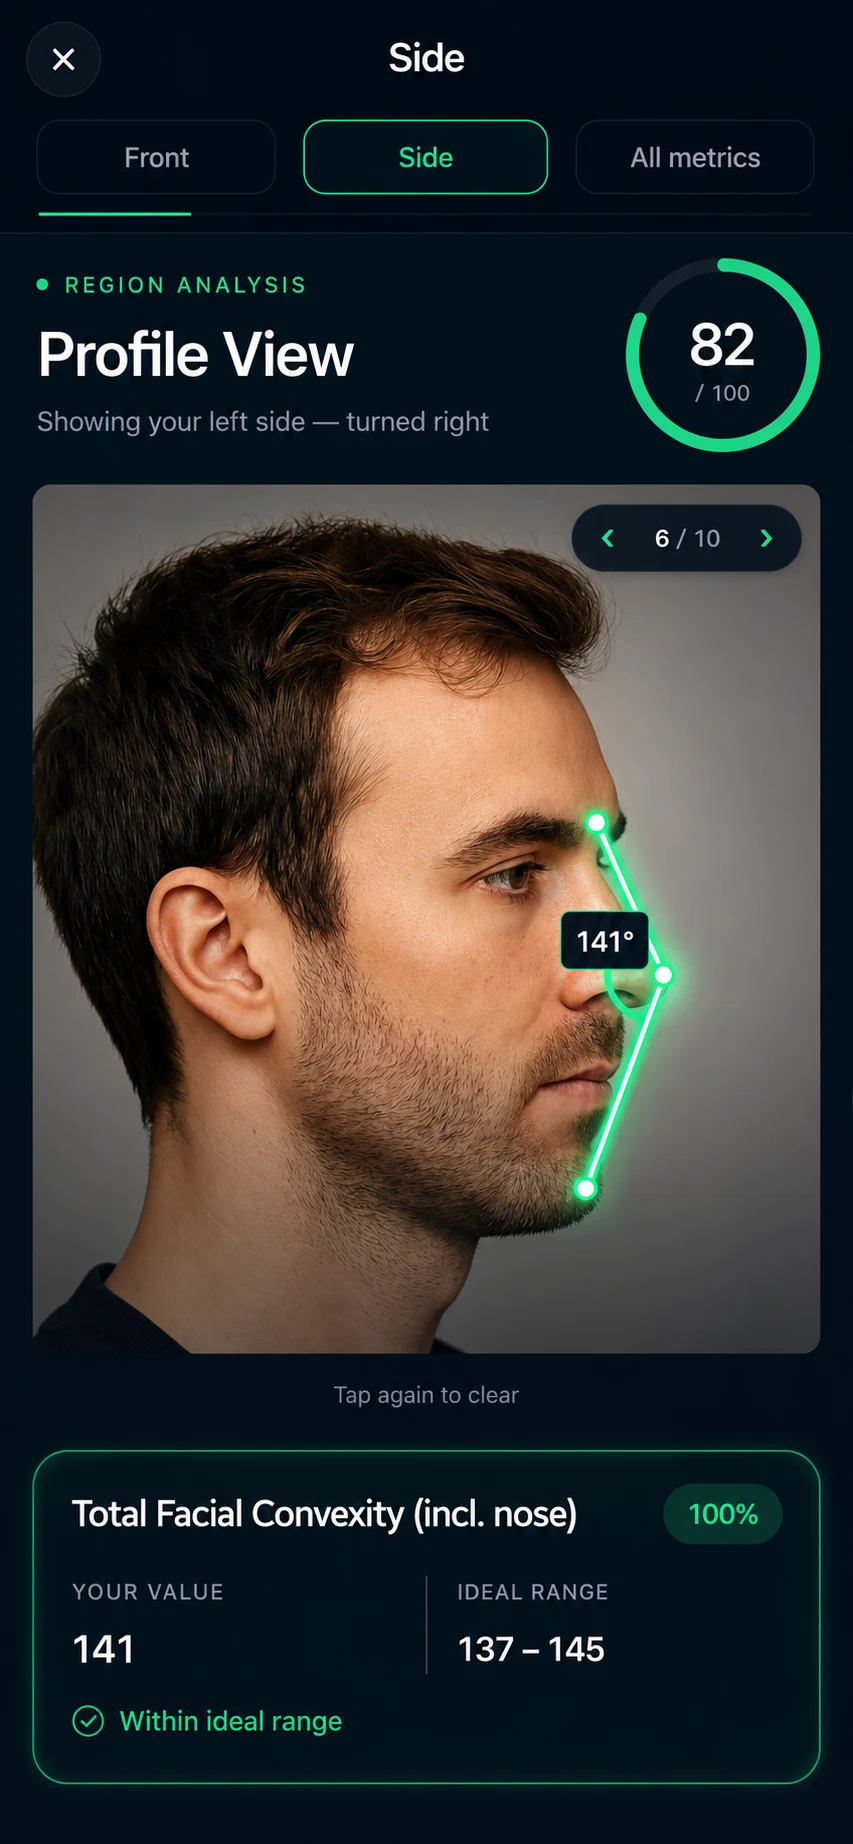
Any app can return a number. The question is whether it can show you the 75 measurements that produced it, the range each was compared against, and where those ranges came from.
Menua Vardanyan · Published · Updated
What the score is made of
Two photos — front and side profile. 468 facial landmarks are placed, then a deterministic engine computes 75 geometric measurements: distances, ratios and angles. Each is scored for how far inside or outside its ideal range it sits, and those roll up through six clusters into one composite.
| Cluster | Measurements | Examples |
|---|---|---|
| Jaw | 14 | Gonial angle, jaw/cheek width ratio, ramus-to-mandible |
| Eyes | 14 | Canthal tilt, eye spacing, medial canthal angle |
| Nose | 12 | Nasal width to face width, nasofrontal angle |
| Lips | 10 | Upper-to-lower lip ratio, philtrum ratio |
| Proportions | 10 | Facial thirds and fifths, lower-face percentage |
| Midface | 7 | FWHR, midface ratio, midface tapering |
A separate bilateral symmetry score is computed from 8 more measurements across paired landmarks, and skin is assessed separately again — symmetry and skin are reported on their own rather than hidden inside the geometric composite.
Real measurements, real ranges
These are actual metrics from the app, with the published ideal ranges they are scored against. Readings shown are illustrative.
| Measurement | Example reading | Ideal range |
|---|---|---|
| Canthal tilt | 6.2° | Ideal 4–8° |
| Facial width-to-height | 1.87 | Ideal 1.65–2.05 |
| Jaw / cheek width ratio | 0.82 | Ideal 0.78–0.86 |
| Gonial angle | 126° | Ideal 120–130° |
| Midface ratio | 1.02 | Ideal 0.95–1.15 |
| Bilateral symmetry | 0.98 | Ideal 0.97–1.00 |
| Your harmony score | 78.4 | Composite, 0–100 |
What is deliberately left out
- The golden ratio. Phi and canon compliance are computed and displayed, but kept out of the composite. They are art-historical prescriptions, not research findings.
- Global percentiles. You will never see “top 3% worldwide”, because nobody has that dataset. Percentiles are stated against GlowAI’s own user population, and labelled that way.
- An attractiveness verdict. The composite is labelled a geometric score, not a judgment of how attractive you are.
How to read yours
Look at the number once, then ignore it. Go to the ranked list of fixable measurements — the ones where closing the gap would move your score most, and which respond to skin, grooming, body composition, sleep and posture. That list is the reason to scan at all.
Next: how the score maps onto PSL tiers, how the scan itself works, or the six face archetypes.
Common questions
What is a facial harmony score?
A single number describing how closely your facial proportions sit inside documented ideal ranges. In GlowAI it is a weighted composite of 75 geometric measurements across six clusters — jaw, eyes, nose, lips, proportions and midface — each scored against ranges from published anthropometric research.
Is facial harmony the same as attractiveness?
No, and GlowAI is deliberate about not conflating them. Harmony measures geometric relationships against population ranges. Attractiveness involves expression, grooming, symmetry in motion, personality and context — none of which a static measurement captures.
Does the golden ratio determine the score?
No. Phi and the classical canons are computed and shown as descriptive compliance sub-scores, but they are deliberately kept out of the composite. They are Renaissance art prescriptions, not findings from facial research, and folding them into a score would make it less honest rather than more scientific.
Are the ideal ranges the same for men and women?
Not where the research says otherwise. 49 of the 75 measurements use sex-specific ranges — FWHR, philtrum ratio, gonial angle, nasolabial angle, mentocervical angle and lip fullness among them, because the literature establishes a real difference.
What is a good facial harmony score?
Around 50 is genuinely mid. 60 and up reads above average, 80 and up is rare, 90 and up is roughly the top 1%. But the composite is the least actionable part of the result — the ranked list of fixable measurements underneath it is what you can actually use.
Sources
Ideal ranges are taken from published anthropometric literature. Every metric in the app carries its own citation; these are the works the set is built on.
- Farkas LG. Anthropometry of the Head and Face. 2nd ed. Raven Press, 1994. (opens in a new tab)
The reference dataset for human craniofacial measurement — the source of most normative ranges in use today.
- Powell N, Humphreys B. Proportions of the Aesthetic Face. Thieme-Stratton, 1984. (opens in a new tab)
Defines the profile angles — nasofrontal, nasofacial, nasomental, mentocervical — used in the side-profile analysis.
- Naini FB. Facial Aesthetics: Concepts and Clinical Diagnosis. Wiley-Blackwell, 2011. (opens in a new tab)
Modern synthesis of facial proportion assessment, and the source for several vertical-thirds and horizontal-fifths ranges.
- Sarver DM. Esthetic Orthodontics and Orthognathic Surgery. Mosby, 1998. (opens in a new tab)
Soft-tissue analysis — lip projection, smile arc and incisor display.
- Mommaerts MY, et al. Published work on facial proportion and orthognathic planning. (opens in a new tab)
Contemporary maxillofacial ranges, including midface and chin projection.
- Steiner CC. Cephalometrics for you and for me. Am J Orthod, 1953. (opens in a new tab)
The Steiner analysis — the cephalometric baseline for skeletal relationships.
- Tweed CH. The Frankfort-mandibular incisor angle in diagnosis and treatment planning. (opens in a new tab)
The Tweed triangle, behind the mandibular-plane and incisor-angle metrics.
- Google. MediaPipe Face Mesh / Face Landmarker. (opens in a new tab)
The landmark detector that places 468 points on each photo, before any measurement is computed.
Get your face score. It takes 30 seconds.
Free first scan on iPhone and Android. See the numbers before you decide anything.